
netclaw stats
netclaw stats tells you where your tokens are going, how many sessions are running, whether memory is healthy and which skills get loaded. It also covers channel activity, webhook deliveries and reminders. --json is for scripts and --tui opens a dashboard.
netclaw stats [options]netclaw stats skills [options]It needs a running daemon. If it’s down, start it with netclaw daemon start (docker restart <container> in Docker), or run netclaw init, which starts it for you.
Options
Section titled “Options”| Flag | Description | Default |
|---|---|---|
--days <N> | Add a daily breakdown for the trailing N days (a positive integer) | No daily table |
--all | Add an all-time daily breakdown | Off |
--tui | Open the dashboard | Off |
--json | Alias for --format json | |
--format <text|json> | Output format | text |
An unknown option, a bad --days value or a bad format prints [FAIL] stats options: ... with the usage and exits 1.
Output
Section titled “Output”netclaw statsnetclaw stats — usage since daemon started (8m 40s ago)
this process: tokens: in=150 out=90 turns: 10 memories: formed=0 recalled=0 skills loaded: 2
sessions: total: 19 active: 11 turns (all-time): 17
memory (healthy): anchors: 0 documents: 0 records: 0 edges: 0 pending checkpoints: 0
skills: available: 8
webhooks: routes: total=0 enabled=0 disabled=0 invalid=0 deliveries: accepted=0 filtered=0 duplicate=0 rejected: 404=0 401=0 413=0 400=0 429=0
reminders: scheduled: 0 active: 0 failed: 0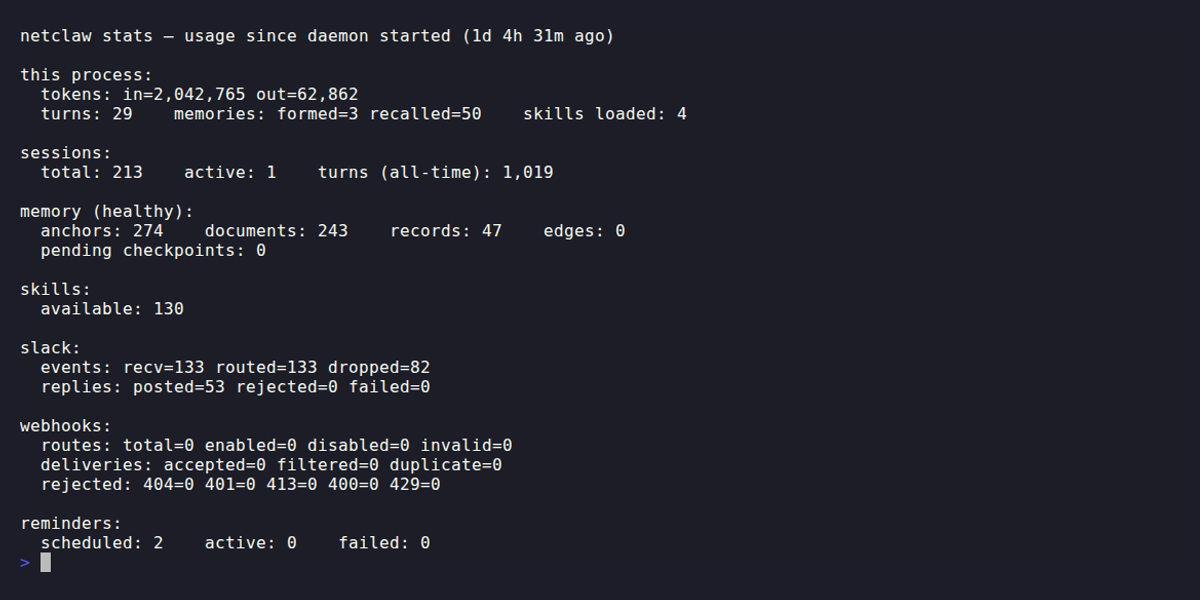
This daemon had been up about three minutes and had handled three short chats, so tokens and sessions are non-zero. It’s the same demo install as the other status screenshots, so skills, webhook routes and scheduled reminders match what netclaw skill list, netclaw webhooks list and netclaw reminder list show. Enabling Slack adds a slack section.
| Section | What it shows |
|---|---|
| this process | Tokens in and out, turns, memories formed and recalled, and skills loaded |
| sessions | Total, active and all-time turn counts |
| memory | healthy, degraded or unavailable, with anchor, document, record and edge counts and pending checkpoints |
| skills | How many skills are available |
| <channel> | Per-channel events (recv, routed, dropped) and replies (posted, rejected, failed). Printed for channels with activity. |
| webhooks | Route counts, delivery counts and rejections by HTTP status |
| reminders | Scheduled, active and failed counts. failed counts enabled reminders that currently have consecutive failures. A reminder you disable, or one that has since run cleanly, drops out. |
The this process counters live in the daemon’s memory and reset when it restarts. Sessions, memory and the daily breakdown come from SQLite and survive restarts. If memory reads degraded or unavailable, run netclaw doctor.
Daily breakdown
Section titled “Daily breakdown”netclaw stats --days 7date in tokens out tokens turns sessions mem formed mem recalled skills---------- ---------- ---------- ----- -------- --------- ------------ ------2026-10-14 240 144 17 20 0 0 2Use --all for all time. With more than one day of data, a totals row closes the table.
Dashboard
Section titled “Dashboard”netclaw stats --tuinetclaw stats --tui --days 30The dashboard shows token totals, activity and a bar chart of daily token use, defaulting to the last 7 days. When there’s no daily data, the memory, per-channel and webhook panels take the chart’s place.
Only Ctrl+Q quits. Q, Esc and Ctrl+C don’t close the view. --tui is ignored by stats skills, which prints the plain-text report instead of opening a dashboard.
Skill usage
Section titled “Skill usage”stats skills counts skill loads per day, by how they were loaded and by skill:
netclaw stats skills # last 7 daysnetclaw stats skills --days 30netclaw stats skills --allnetclaw stats skills — all time
2026-10-14 total=2 by method: slash-command=2 run-reminder: 2 (slash-command=2)The three load methods are slash-command (you typed /name, see Slash commands), skill-load (the model called skill_load) and file-read (a skill file was read directly). Each day lists the top 15 skills, then a count of the rest. With nothing recorded it prints No skill loads recorded.
JSON output
Section titled “JSON output”netclaw stats --jsonThe keys are camelCase.
netclaw stats --json | jq '.tokens.inputTokensTotal'netclaw stats --days 7 --json | jq '.dailyBreakdown[] | {date, inputTokens, outputTokens}'netclaw stats --json | jq '.sessions.activeSessions'netclaw stats --json | jq -r '.memory.status'netclaw stats skills --json | jq '.daily[] | {date, totalLoads}'The top-level keys are process, tokens, sessions, memory, skills, channels, webhooks, reminders and dailyBreakdown. stats skills --json has a single daily array whose entries hold date, totalLoads, methods and skills.
Exit codes
Section titled “Exit codes”| Code | Meaning |
|---|---|
0 | Success |
1 | The daemon is unreachable or answered with an error, or the options were wrong |
When the daemon isn’t running
Section titled “When the daemon isn’t running”[FAIL] stats: unable to reach daemon at http://127.0.0.1:5199: Connection refused (127.0.0.1:5199) fix: run `netclaw daemon start` and retry.A daemon that answers with an error status, such as 503 while starting, prints [FAIL] stats: daemon returned 503 from <endpoint>. stats finds the daemon the same way netclaw status does: NETCLAW_DAEMON_ENDPOINT, then ~/.netclaw/client/config.json, then netclaw.json, then http://127.0.0.1:5199.
Related pages
Section titled “Related pages”netclaw status: live health for the daemon, connectors and modelnetclaw doctor: config diagnostics with--fixnetclaw sessions: dig into the sessions behind the counts- Memory model: what the memory counters measure
- OpenTelemetry: export the same signals to a collector
Resources
Section titled “Resources”- jq manual: work with
--jsonoutput - SQLite documentation: the daily breakdown is stored in SQLite
 Built by Petabridge